The dynamometric chart is a very important record in the oil industry, which represents the instantaneous loads on the polished rod at different positions during the piston pumping cycle, very useful for the production engineer. The concept of dynamometry is to interpret at the surface what is happening at the bottom of the well.
From these records, conclusions can be drawn to know:
- The total weight of the rods (necessary to check that the unit is not overloaded).
- The volumetric efficiency of the pump.
- The need to carry out an underground program (make adjustments to the pump) so that the pump can work in optimum conditions.
The most representative operating parameters in a diagram are: maximum and minimum loads on the rods, rod and pipe elongation, effective stroke of the pump piston, dynamic level and suction pressure of the deep well pump, existence of losses due to valves (fixed and mobile) and flow actually displaced by the deep well pump.
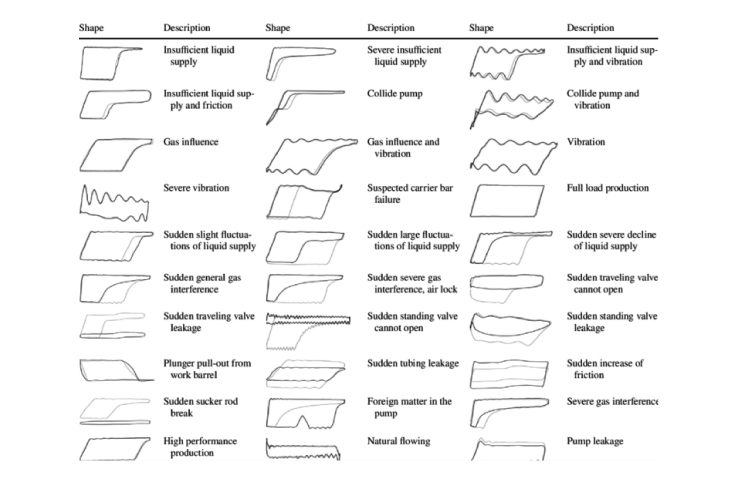
Common Problems with Dynamometric Charts
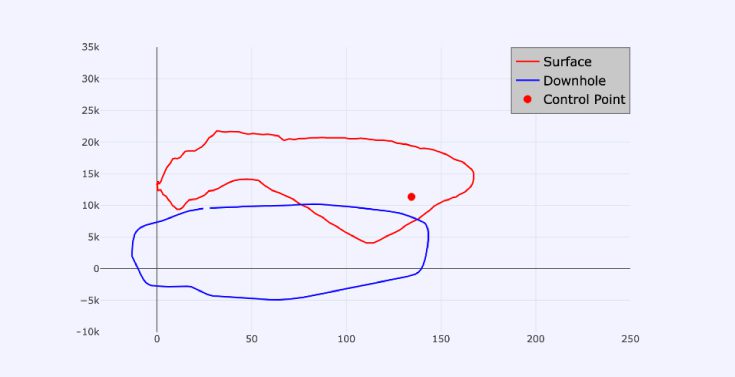
A dynamometric chart has an ascending and descending stroke. If we measure the load and displacement on the surface, it is possible to measure the pressure on the surface, but not the pressure we have at the bottom. This can be seen in the red surface curve and in the displacement points of the graphs shown below. When a mechanical part gets stuck, we feel the maximum pressure above and nothing happens below.
Currently, there are mathematical models that draw the blue curve of depth, which comes from a mathematical-physical model that is adjusted for various factors such as the depth of the vertical well or the type of formation, etc. The problem is that we have to monitor these factors.
The problem is that we need to monitor these records in the different wells with a real application, with a control point where the curve is drawn, and if this control point is outside an alarm sounds reporting a problem in the pumping.
Obviously, someone has to check the graphs from time to time, and usually these interpretation analyses are done every five minutes, but if a human is not paying attention, risks can arise. Usually, this task exceeds the operators and engineers who cannot cope with the work with the equipment or even human overload or fatigue.
Considering that there are oil companies that typically have 500 wells and about 1,500 graphics to monitor simultaneously, and the only variable to look at is the control point, which may be out of its region, monitoring is very reactive. It usually does not anticipate failures or even respond to failures hours after they occur. And sometimes discovering failures after they have occurred causes significant losses to the company, both material and economic.
In fact, if the well empties too fast, when the control point goes out, it has a timer and it indicates that we have to wait for it to fill with oil again. There are times when we talk about a gas disturbance, there is a timer, but the fault was not that and the hammer stopped, it was not that there was no oil, but that it was misdiagnosed.
All this complicates a process that is quite reactive and suboptimal.
From Machine Learning to GenAI for Dynamometric Charts
The current opportunity is to diagnose the situation of dynamometric charts with machine learning and be able to anticipate problems before they occur.
There are several traditional machine learning projects applied to oil and gas. Even the use of neural networks, which implies working with a labeled dataset, and some application examples can be seen in this paper.
Machine learning models can also be applied to images by applying computer vision techniques. The main problem is that if the company does not have the images or the diagnosis, and especially if it does not have the labeled data, even if it has the sensors connected, it will not be able to develop a traditional model.
Is it worth paying an engineer to look at these graphs coming from the sensors every 5 minutes? The answer is really no.
And there is a clear opportunity to use GenAI for the diagnosis of dynamometric charts, and it is part of the learning process that the energy industry is going through.
This is the case of using a multimodal model to make a very detailed diagnosis that does not overload human operators and at the same time does not require so much effort.
It is really amazing what we can do. Because taking these graphs and asking an LLM what is happening is very feasible and simple, it does not require big proofs of concept or labeling the company’s data.
And much more: if we can have a conversational agent, an assistant that answers key questions about the risk or the control point that interests us in the dynamometric graphs, this leads us to a greater bet to improve the diagnosis and analysis of real situations. Perhaps we can even configure several control points, not just one.
Without a doubt, the use of GenAI will systematically help oil engineers to have a global vision of the situation and to make better decisions. Because it gives us a world-class capability for observation and analysis.
To be clear, it’s not going to replace the oil engineer, but the oil engineer needs help because he’s overwhelmed and fatigued by everything that his job requires. And the company cannot do a traditional machine learning project with fault classification because it does not have the labeled data.
Benefits of GenAI for Dynamometric Charts
When considering this problem, the ability to diagnose dynamometric charts with GenAI offers the following major advantages:
- Complement the complex task of the petroleum engineer to diagnose and analyze real situations.
- Enhance the ability of teams to improve asset monitoring in general.
- Create a simple and easy to implement model.
- Build a customized assistance model with conversational agents.
- Anticipate failures with greater accuracy or immediately when they occur, reducing costs or economic losses.
Obviously, addressing this process with GenAI is much easier than training a dataset with thousands and thousands of images (and computer vision techniques) to build a large custom machine learning model with the labeled data, which is often impossible.
The key is to improve the LLMS prompts with the key diagnostic questions that can be asked about the dynamometric charts.
7Puentes: your strategic partner in oil and gas
For more than 15 years, we have proven experience in more than 100 artificial intelligence, data science and machine learning projects for leading companies.
Our extensive expertise in the oil and gas sector and our ability to develop customized artificial intelligence solutions make 7Puentes the ideal partner for any industrial project.
If you want to know more about how to approach the problem of diagnosing dynamometric charts with GenAI, contact our specialists now.