AI in Anomaly Detection
We are witnessing something of a revolution in the Internet of Things (IoT) in the energy industry, as it is possible to monitor any industrial device or machine in real time using sensors, software, and technologies that exchange data with other devices over the Internet. However, the early detection of anomalies and failures in equipment remains a complex problem to solve. Learn how artificial intelligence and machine learning can be applied to anomaly detection in the oil and gas industry.
The Internet of Things (IoT) describes the network of physical objects («things») that have built-in sensors, software, and other technologies to connect and exchange data with other devices and systems over the Internet. These devices range from common household items to sophisticated industrial tools. With more than 10 billion IoT devices connected today, experts predict that number will grow to 22 billion by 2025.
Industrial IoT is part of this revolution and has a strong impact on the energy sector, especially in the area of preventive and predictive maintenance. According to consulting firm Acumen, the global oil and gas IoT market was valued at $11.2 million in 2022 and is expected to grow at a CAGR of 9.7% over the forecast period (2024 to 2032), reaching $27.7 million in 2032.
There is no doubt that the implementation of IoT in oil and gas companies is profitable and viable: it enables real-time data collection and remote monitoring of equipment performance to detect maintenance issues, failures, leaks and oil spills. All of this helps to plan and make decisions based on digitized data, a process that was previously done with traditional software and hardware.
How to deal with the abundance of data, signals and images.
Given that there is an unprecedented amount of data, all of this data needs to be centralized in a Data Lake as a central repository that can be accessed in real time. The prerequisite for this is that the company already has the physical assets wired and connected by sensors, with all the data flowing into a data repository.
It is important to be able to organize this data, which is usually not only in the form of different signals with variables on a monitor (pressure, temperature, vibration, speed, etc.), but can also be real-time images in the case of thermal cameras and drones looking for leaks or spills.
The norm is not easy to find
We generally assume that there is a constant normal behavior and that anything that deviates from that behavior is an anomaly. The problem is that detecting this normal behavior is not a common task and goes beyond traditional statistical analysis due to three different factors:
- An average is not enough.
- Not everything follows a Gaussian distribution.
- Signals change over time and it is not easy to distinguish signals from noise.
This shows that reality is often heterogeneous and multidimensional, i.e. it is made up of multiple variables that may not follow a linearity or normality.
The key to detecting anomalies is to manage rules
When our industrial plant is fully wired and sensorized, the first thing we need to do is to determine if many of these signals that we need to monitor are normal or not, if they are normal, if these exceptional increases that we find are relevant or noisy.
The example is the pressure in an oil well, and the stimulus has to do with the amount of signals or noise that is happening, which can be very noisy.
At the same time, operators can be fatigued by the fatigue of the monitoring itself (because they have to look at many monitors with hundreds of signals at the same time) and by the saturation of alerts that ultimately do not mean an anomaly, that is, they are just spam.
When we find something with normal, predictable behavior, the way to detect anomalies is to set rules. Of course, these rules can be set manually or automatically.
They are rules that mark thresholds, for example, if the consumption at 120 km/h is above a certain normal value, then it is considered an anomaly. The problem moves to the creation of rules, because if we have many assets and many particular situations (because each device is different), each one will have its own behavior.
In this case, the two types of rule creation are
- Manual: Operators create the rules and constantly monitor these variables. This could be an ideal situation, for example, if we are monitoring a solar panel where we have 10 thousand devices and they are all the same, maybe we can implement about 25 wired rules that are well understood and the problem is over. Because they are all the same.
- Automatic: This alternative assumes that the rules are created automatically by the machine learning model, because the operators are independent of this creation. It is not that manual rules are wrong, it is the scale of the problem. In the case of automated rules, you have a phase where you have to monitor without creating rules, without training, but if there is a failure, you skip it because you are in the process of creating rules.
The challenge is to tell the model what problem we want to detect so that a new rule can be created. If you plug it all in and ask it to monitor the devices or the physical assets, the model will take averages, it will do the negative factorial decomposition, of frequencies and trends, to get to the point where it says this speed and this other is normal, this frequency is normal, these peaks and these others take the statistics. And with those estimates, we would have a specific anomaly detection model for that behavior. - GenAI can be an alternative: Obviously, the task of detecting these anomalies is complex because it is difficult to predict because not all signals behave the same way and some of them are so noisy that there is no rule (manual or automated) that can solve the problem. At the same time, the behavior of these systems is complex and nonlinear, which means that there is a lot of uncertainty and lack of predictability about when it might fail.
In this case, GenAI can be used and would reduce the fatigue, the saturation that operators can feel from constantly monitoring such complex things. So we can have a rule-based alerting system, and if the rules are throwing a lot of false alarms or false positives, then with GenAI you can relieve the operator of those false positives so that the interpretation is a little more agile. It is a very good way to improve the whole system.
On the other hand, there are specific failures (such as spills or leaks) where custom algorithms can be used to solve a very specific problem with models that already have enough testing and research behind them.
From Univariate to Multivariate Solutions
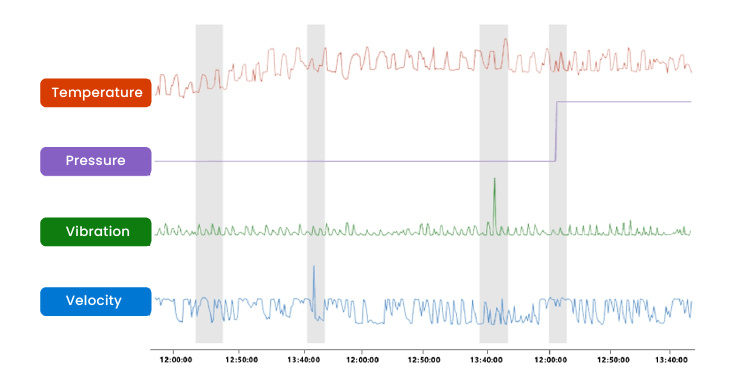
In general, the traditional approach tends to look for the anomaly in a single variable or in each individual variable, without seeing the relationship between them. For example, in this graph, we have four different variables: temperature, pressure, vibration, and velocity. The question is which one is a normal value, you observe it and if it does not have clear rules, it is difficult to interpret it.

And the anomaly may not be in a single variable, but there are direct relationships between the variables. For example, in a trend, the temperature goes up and down, but the problem is not in the temperature, but in the relationship between the temperature and the vibration, or even if we add the velocity as a variable (if we divide the temperature by the vibration, we get a different value, and if we multiply it by the speed, we also get a different value). With this relationship between the signals we can observe more than with a single signal.
Let’s say we have a model where we apply a new variable called «operating efficiency,» which is the result of vibration times speed divided by temperature plus pressure. And we compress it into a single signal, we solve my multivariate problem in one. The idea is super interesting, but we need a team of engineers to build the model, do the calculations to solve it, and say we are going to talk about closed efficiency in these devices. Because maybe this anomaly has already been studied, there are already geologists or petroleum engineers talking about it, but we have to develop a model that produces these variables.
So the question is how do you solve the problem with the multivariate approach. The real multivariate is that we have 50 of these signals that the company does not know for sure how they are related, so a machine learning model is asked to somehow find a relationship between them. This is summarized in the use of Principal Component Analysis (PCA) with an auto-encoding model, which is to find that relationship that is not obvious to operators and engineers.
AI is the cornerstone for automated non-linear anomaly detection solutions
To tackle these multivariate problems, the autoencoder model or the family of autoencoding algorithms is very useful because these signals provided by the sensors can be chaotic and no team of professionals, even with all their know-how, can interpret them. Because this is part of the disorder that the world of transformers and GenAI has created.
The concept is that we have a lot of signals that are typical of the use of IoT (completely complex because if you take these signals from IoT, they are just meaningless proxies) where the anomaly is more in the relationship between them than in observing a single variable, but we can’t find a way to relate them. And you ask ML to relate them, with a specific error. It can be calculations where you have 20 variables, maybe it is not a linear formula between those 20, maybe it is a time window of 100 multiplied by 20, that are non-linear and not simple formulas. And we have to see how it works, with what margin of error. It is a nonlinear complexity problem. And many times within the autoencoders we have activation functions that are non-linear. We don’t care at 0.99, but we care at 1. That is non-linear.
How do we understand non-linearity in this case? The overflow of an expected behavior is a non-linear behavior (when climate change breaks out, where dozens of cities were flooded overnight). Gas or oil leaks can be something that was more or less there until it suddenly broke. Changes in wind direction to measure the behavior of wind turbines are clear examples, because even if we have the right meteorology, it completely changes the rules of how that turbine works (it spins).
Non-linearity makes machine learning a tool to manage these rules to be defined and these situations of correlation between many variables. The important thing in this case is to have an adequate ML solution to solve the problem, with a problem that takes into account the correlation between the different variables of our systems.
7Puentes: the key to success in AI anomaly detection
When you have to make a decision for anomaly detection within your energy company, you do not necessarily have to look for rules management or buy a canned software tool.
To understand which solution to manage, you should first understand what situation your company is in (for example, if you do not have a data lake, you would need to build one first, otherwise you would not have organized your data and the sensors you have might not be useful in this case).
At 7Puentes, we have the know-how and extensive experience that comes from more than 15 years of work and more than a hundred companies with very diverse projects in artificial intelligence, web data extraction and machine learning, including the oil and gas industry.
We are experts who can advise you on the creation of appropriate solutions for anomaly detection in your company and guide you towards the best possible solution.


